Year 9 physicsAQA GCSE Physics & Combined Science

Evidence.
Not guesses.

Measure, question, reveal, defend

uncertaintyerrorsvariablesgraphsanomalous resultsconclusions
REPEAT
3 TIMES
PLOT
THE
MEAN
THE PATTERN

Find the signal.
Challenge the odd point.

TRUST
THE
DATA?

AQA Working scientifically (WS) · Physics 8463 & Combined Science 8464

Seven missions. One skill.

01

Trust the data?

Uncertainty, precision, errors

WS 2.6, 3.4, 3.7Both courses

02

Variables & graphs

Change, measure, control

WS 2.2, 3.1Both courses

03

The drop test

Repeats, means, bar charts

WS 2.4, 3.1, 3.3Both courses

04

Ramp line graph

Scales, plotting

WS 2.6, 3.1Both courses

05

Best fit & anomalies

Trends, odd points, conclusions

WS 3.5, 3.6Both courses

06

Solo flight

The whole process, on your own

WS 2.2, 2.7, 3.1Both courses

07–08

Your investigation

How does \(X\) affect \(Y\)? Plan, run, defend

WS 1.6, 2.1, 2.7, 3.8Both courses

Work like a physicist

01 Mission 1: Measurement detective

Can this data be trusted?

precision vs accuracyuncertainty from repeatsrandom & systematic errorresolution

AQA spec: WS 2.6, 3.4, 3.7Physics and Combined Science

THE CASE (2011)

The loose cable that broke physics

  • Neutrinos timed over 730 km
  • Arrived ~60 ns before light?
  • Thousands of repeats, very consistent
  • Cause: a loose cable connection
  • Precise, but not accurate
Mission 1: Trust the data?
The EvidenceMission 1 · the case
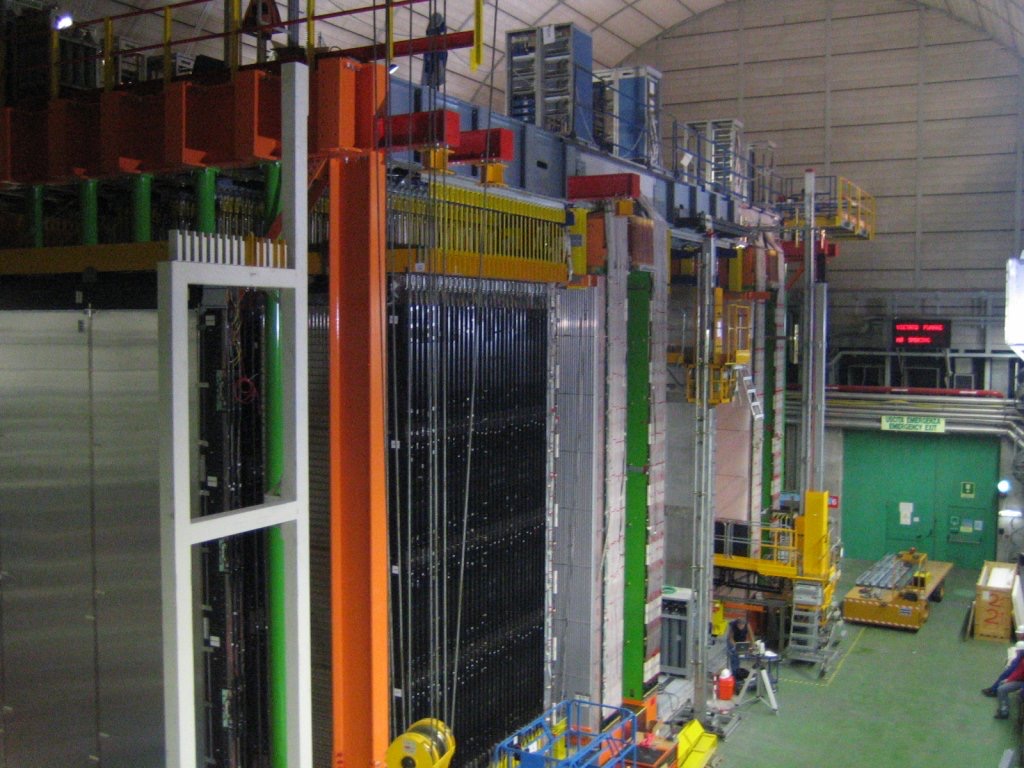
A hall-sized particle detector with tall racks of equipment, gantries and a yellow lift
The OPERA neutrino detector at Gran Sasso, Italy, while it was being built in 2005. Photo: Mhier, CC BY-SA 3.0, via Wikimedia Commons

Breaking

Neutrinos clocked faster than light

Particles sent 730 km from Switzerland arrive about 60 nanoseconds early. Thousands of repeats agree.

Talk about itThousands of repeats agreed. Why did none of them show the fault?
Mission 1: Trust the data?

01 Starter

Which data would you trust?

Same car, same ramp, three students
SetTrial 1 / sTrial 2 / sTrial 3 / sMean / s
A1.201.231.191.21
B1.051.471.121.21
C0.900.930.890.91
  • A: close together → precise
  • B: same mean, big spread → less precise
  • C: precise, but far from 1.21 s → not accurate?
Spread of each set
Mission 1: Trust the data?

01 Key idea

Precise ≠ accurate

PreciseRepeats close to each other
AccurateClose to the true value
Consistent does not mean correct: a systematic error can shift every reading.
Mission 1: Trust the data?

01 Put a number on the doubt

Uncertainty

\((\text{max} - \text{min}) \div 2\)uncertainty from repeat readings
Example1.20 s, 1.25 s, 1.21 s
Mean
\(3.66 \div 3 = 1.22\) s
Max − min
\(1.25 - 1.20 = 0.05\) s
Uncertainty
\(0.05 \div 2 = 0.025\) s
Result
\(1.22 \pm 0.03\) s
Mean \(\pm\) uncertainty
Mission 1: Trust the data?

01 Two errors

Only one is reduced by repeating

Random error

  • Spreads readings both ways
  • e.g. reaction time with a stopwatch
  • Fix: repeat + mean, light gates

Systematic error

  • Shifts every reading the same way
  • e.g. balance reads 0.2 g when empty (zero error)
  • Fix: check zero, calibrate; repeats don’t help
Mission 1: Trust the data?

01 What can the instrument see?

Resolution

ResolutionThe smallest change an instrument can detect
Ruler, mm marks1 mm
Stopwatch0.01 s
Balance0.1 g
Better resolution → finer readings, but it does not remove a systematic error
Mission 1: Trust the data?

01 AQA key words

Say it like a physicist

PreciseLittle spread about the mean
AccurateClose to the true value
UncertaintyThe interval within which the true value can be expected to lie
RangeThe maximum and minimum values of the independent or dependent variables
RepeatableSame person, method, kit → same results
ReproducibleAnother person, kit or technique → same results
ResolutionSmallest change the instrument can show
Random errorUnpredictable spread; reduce with repeats
Systematic errorSame shift every time; check the method
Zero errorReads a value when it should read zero
Mission 1: Trust the data?

01 Checkpoint

Quick check

12.31 s, 2.47 s, 2.38 s. Mean?

\(7.16 \div 3 = 2.39\) s

2Uncertainty for the same readings?

\((2.47 - 2.31) \div 2 = 0.08\) s

3Tight group, all 5 cm too high?

Precise, not accurate: systematic error

4Balance reads 0.2 g with nothing on it?

Systematic (zero) error; reset to zero

5Why do repeats help with random error?

Spread goes both ways, so the mean evens it out

6Resolution of a ruler with mm marks?

1 mm
PRESS → TO REVEAL EACH ANSWER

02 Mission 2: Decode any investigation

What are you actually changing?

independent variablecontinuous vs categoricline graph or bar chart

AQA spec: WS 2.2, 3.1Physics and Combined Science

THE CASE

The study that proved nothing

  • Energy-drink group scored higher in a test
  • Drinkers: tested in the morning
  • Non-drinkers: tested after lunch
  • Two things changed → no conclusion
Mission 2: Variables & graphs
The EvidenceMission 2 · the case
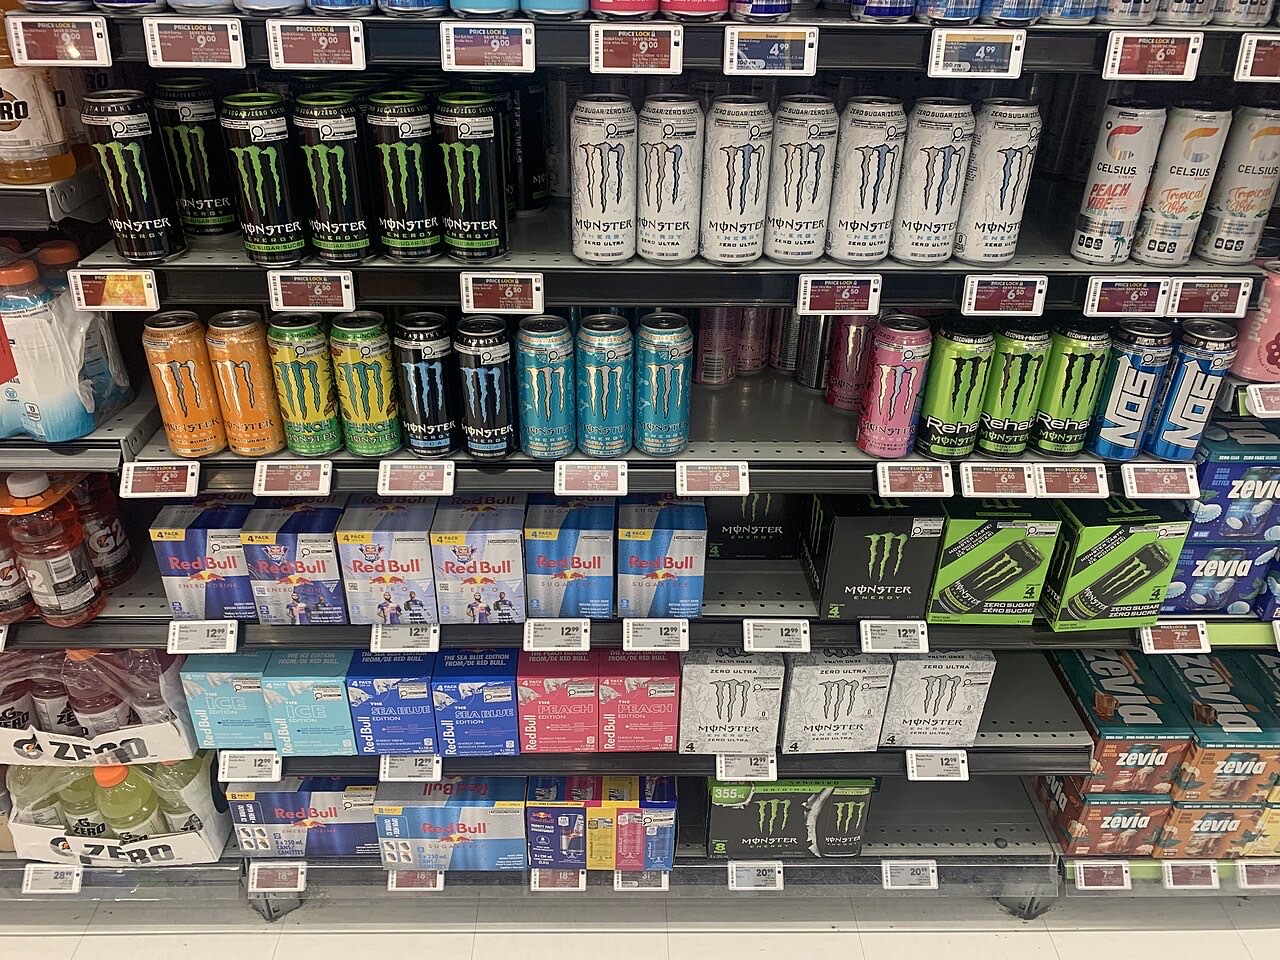
Shop shelves filled with cans of energy drink
Energy drinks on a real shop shelf. The company, the advert and the study in this story are invented. Photo: Coolgurl5555, CC0, via Wikimedia Commons

Advert watch

“Our drink makes you smarter”

A drinks company says students who drank its product scored higher in a maths test than students who did not.

Talk about itWhat would you change to make this a fair test?

Mission 2: Variables & graphs

02 Take the question apart

Change. Measure. Control.

  • Independent: the one thing I change
  • Dependent: the thing I measure
  • Control: everything I keep the same
  • Change only one thing at a time
How does length affect a pendulum’s period?
Mission 2: Variables & graphs

02 Two kinds of data

Continuous or categoric?

  • Continuous: any value on a scale
  • length, time, temperature, mass
  • Categoric: names or types
  • material, colour, surface, brand
  • Test: is there a value in between?
Mission 2: Variables & graphs

02 Key rule

Which graph?

RuleContinuous → line graph
Categoric → bar chart

“My results are numbers, so it’s a line graph.”

Check the independent variable.

The dependent variable is usually a number either way.
Mission 2: Variables & graphs

02 Line or bar?

Sort the investigations

1Temperature → dissolving time

Line, because temperature is continuous

2Surface type → distance a car rolls

Bar, because surface is categoric

3Mass → stretch of a spring

Line, because mass is continuous

4Paper towel brand → water absorbed

Bar, because brand is categoric

5Pendulum length → time period

Line, because length is continuous

6Material → sound absorbed

Bar, because material is categoric
PRESS → TO REVEAL EACH ANSWER

02 Stretch

Fix the broken plan

The plan

  • Expensive ball: dropped from a window
  • Cheap ball: dropped from a hand
  • “See which bounces better”
Fair questionHow does \(X\) affect \(Y\)?

Problem 1

Two things change

Ball and drop height. Fix: same height

Problem 2

“Better” is vague

Measure bounce height / cm

Problem 3

One go each

3 trials per ball, find the mean

Mission 2: Variables & graphs

02 Checkpoint

Quick check

1Independent variable means…

The one variable that is deliberately changed

2Dependent variable means…

The variable that is measured

3Water temperature → dissolving time. Graph?

Line graph, because temperature is continuous

4Is surface type continuous or categoric?

Categoric

5Why control variables?

If two variables change, you cannot tell which caused the result

6Does the DV decide the graph?

No, the independent variable does
PRESS → TO REVEAL EACH ANSWER

03 Mission 3: Bouncing balls → evidence

Which material absorbs the shock?

three trials and a meanresults tablesbar chart quality

AQA spec: WS 2.4, 3.1, 3.3Physics and Combined Science

THE CASE

Why helmets are made of foam

  • Foam is crushed in a crash
  • Head stops over a longer time
  • → smaller force on the skull
  • Found by drop tests, not guesses
Mission 3: The drop test
The EvidenceMission 3 · the case
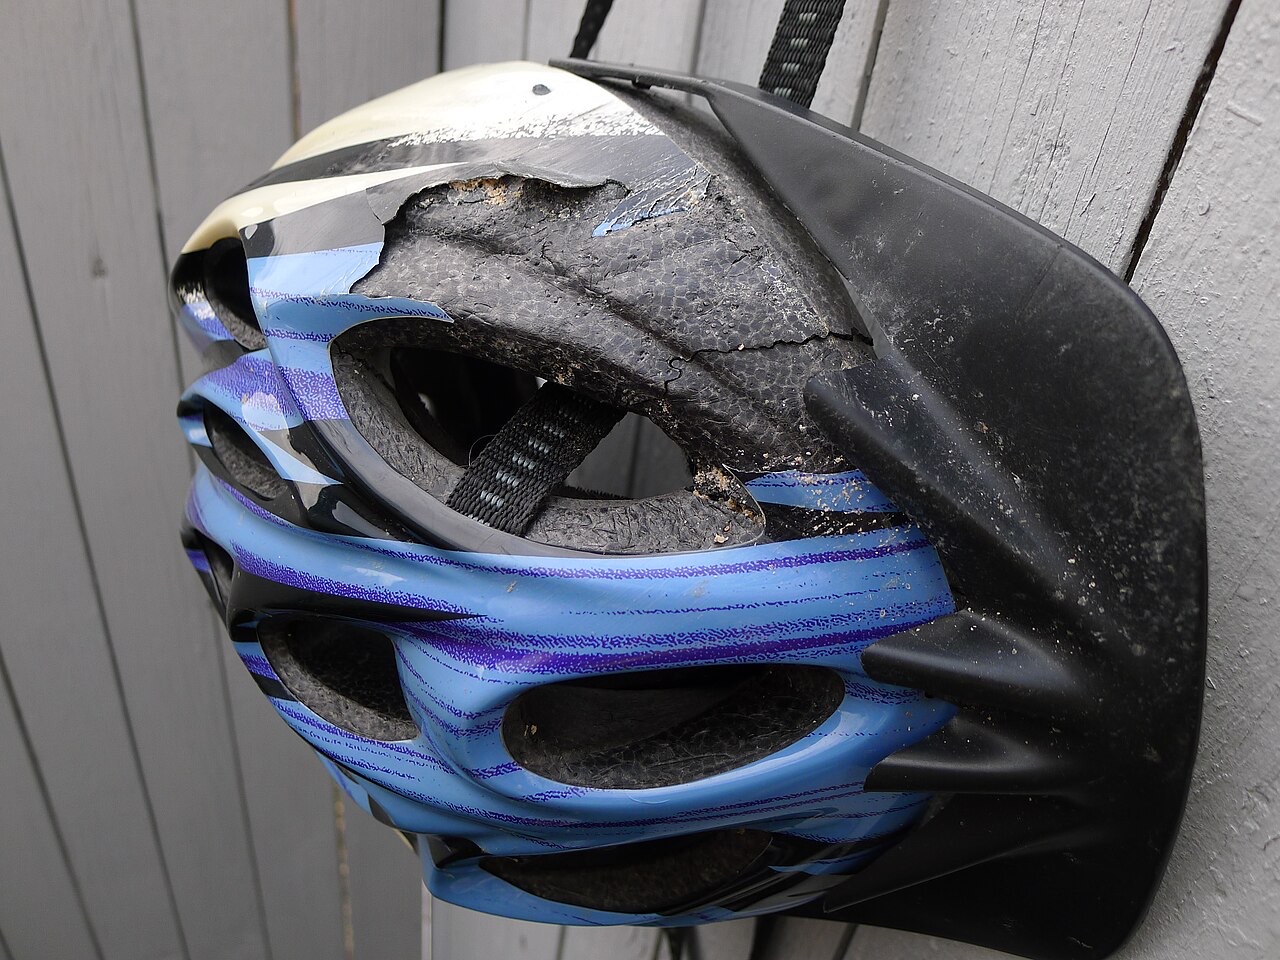
A cycle helmet with its outer shell torn open and the foam underneath cracked and crushed
A cycle helmet after a racing crash at 40 to 50 km/h on a gravel road. The rider had a black eye and bruises. Photo: Otoomet, CC0, via Wikimedia Commons

How it works

The helmet that is built to break

The foam is crushed in a crash. The head takes longer to stop, so the force on the skull is smaller.

Talk about itWhy is one drop on one helmet not enough?

Mission 3: The drop test

03 Variables first

The drop test

QuestionHow does material affect bounce height?
  • Independent: material (categoric)
  • Dependent: bounce height / cm
  • Control: same ball, drop height, release, ruler position
  • Lowest bounce = best shock absorber
Mission 3: The drop test

03 Method + safety

How to run it

  1. Choose 4–5 materials
  2. Ruler vertical, 0 cm at the surface
  3. Drop from 50 cm, no push
  4. Read the first bounce at eye level
  5. Repeat: 3 trials per material
  6. Calculate each mean

Safety

  • Drop, never throw
  • Stable surface for materials
  • Keep clear of the drop zone
Odd reading? Check it now, while the kit is out.
Mission 3: The drop test

03 Record it properly

Results table

MaterialTrial 1 / cmTrial 2 / cmTrial 3 / cmMean / cm
Sponge12151213
Cardboard31322730
Cloth22252223
Rubber mat39354038
Bubble wrap18141917
Mean for cloth\((22 + 25 + 22) \div 3 = 23\) cm
  • Units in the headings
  • Not next to every number
  • One mean per material
Mission 3: The drop test

03 Present it

A bar chart that survives a marker

  • Title: what against what
  • Material on the x-axis
  • Mean height / cm on the y-axis
  • Equal bars, equal gaps
  • Bar height = the mean
  • Sponge: lowest mean, 13 cm → best absorber
Mission 3: The drop test

03 Evaluate

Name the error. Match the fix.

Random

Judging the top by eye

Fast ball, so reading varies → film it with a fixed camera

Systematic

Ruler zero in the wrong place

Every height shifted → check 0 cm at the surface

“There was human error.”

Name the mechanism: “the bounce top was judged by eye”.

“Repeat it to fix the zero error.”

Repeats reduce random error only.

Mission 3: The drop test

03 Checkpoint

Quick check

116 cm, 21 cm, 17 cm. Mean?

\(54 \div 3 = 18\) cm

2A: mean 12 cm; B: mean 38 cm. Better absorber?

A, lower bounce

3Why a bar chart here?

Material is categoric

4Name two control variables

Drop height, same ball (or release, ruler)

5What does each bar show?

The mean, not trial 1

6One random error here?

Judging the bounce top by eye
PRESS → TO REVEAL EACH ANSWER

04 Mission 4: Make a pattern visible

Higher ramp, further travel?

continuous dataaxes, units & scalesaccurate plotting

AQA spec: WS 2.6, 3.1Physics and Combined Science

THE CASE

Nobody guesses a stunt jump

  • Test runs at several speeds
  • Measure the landing each time
  • Plot a graph
  • Read off the speed needed
Mission 4: Ramp line graph
The EvidenceMission 4 · the case
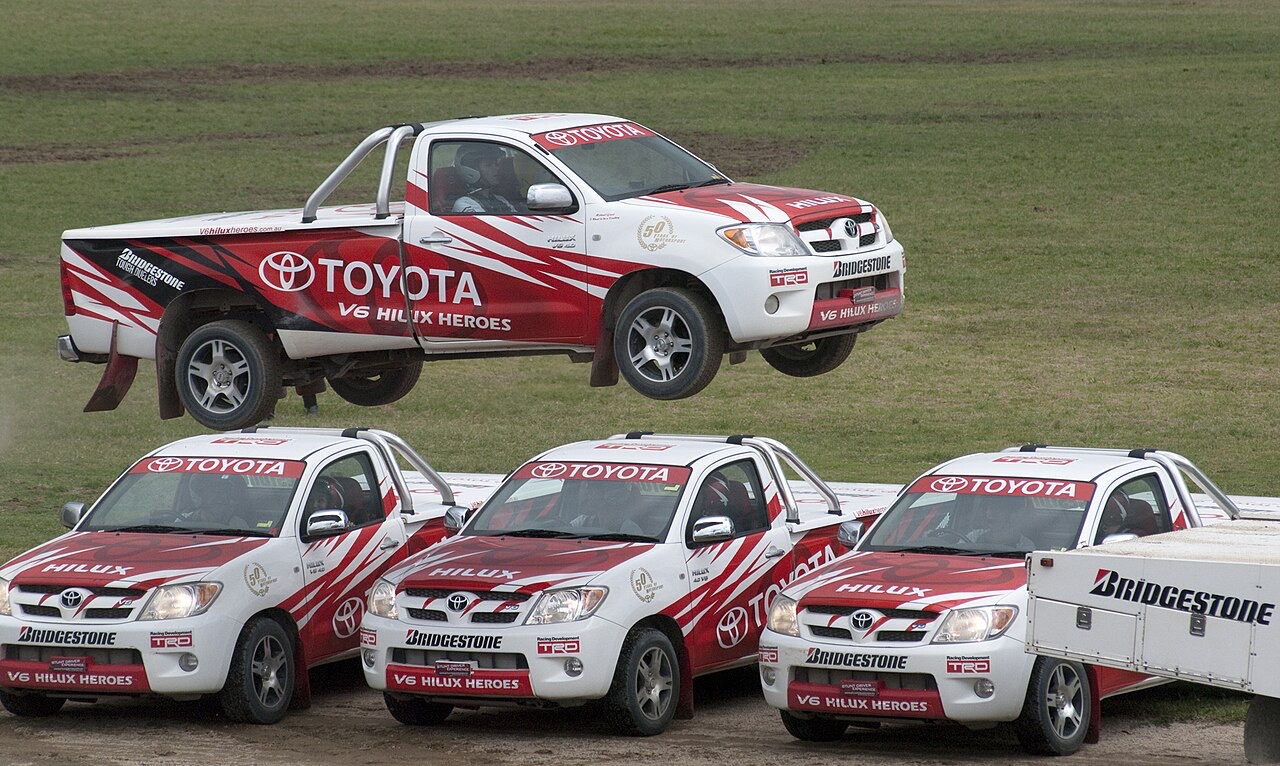
A pickup truck in mid-air above three parked pickup trucks
A pickup truck jumps three others at a stunt show in 2010. Photo: oz_ollie, CC BY-SA 2.0, via Wikimedia Commons

Behind the stunt

Nobody guesses a stunt jump

A stunt team runs the car at several speeds, measures where it lands each time and plots the results.

Talk about itHow many test runs would you want before the real jump?

Mission 4: Ramp line graph

04 Set it up

The ramp

  • Independent: ramp height / cm (continuous)
  • Dependent: distance travelled / cm
  • Control: same trolley, ramp, start line, floor
  • 5 heights: 5 → 25 cm
  • 3 trials each → 15 runs

Safety

Stable ramp, clear lane, never aim at people

Mission 4: Ramp line graph

04 Repeat, record, process

Ramp results

Ramp height / cmTrial 1 / cmTrial 2 / cmTrial 3 / cmMean distance / cm
518212120
1036393637
1551545152
2064696566
2581788180
  • Record as you go
  • Release, never push
  • Measure from the same two points
Trolley veers sideways? Random error → use a marked lane.
Mission 4: Ramp line graph

04 Before you plot

Choose the scale first

RuleLargest value \(\div\) big squares → round up to 1, 2, 5, 10, 20 or 50
ExampleLargest mean 80 cm, 9 big squares → \(80 \div 9 \approx 8.9\) → use 10 cm per square
Mission 4: Ramp line graph

04 Plot it

Plot precisely

  • Independent on \(x\)
  • Dependent on \(y\)
  • Units on both axes
  • Plot the means
  • Small crosses, not blobs
  • No bars, no dot-to-dot
Mission 4: Ramp line graph

04 Checkpoint

Quick check

1What goes on the x-axis?

Ramp height / cm

2What goes on the y-axis?

Mean distance / cm

351 cm, 53 cm, 58 cm. Mean?

\(162 \div 3 = 54\) cm

4Why a line graph?

Ramp height is continuous

5Largest value 45, 10 squares. Step?

4.5 → round up to 5 per square

6Trolley turns sideways. Error type?

Random; use a marked lane
PRESS → TO REVEAL EACH ANSWER

05 Mission 5: Find the signal

The point that does not fit

best-fit linesanomalous result decisionsevidence-led conclusions

AQA spec: WS 3.5, 3.6Physics and Combined Science

THE CASE (1985)

Too strange to believe

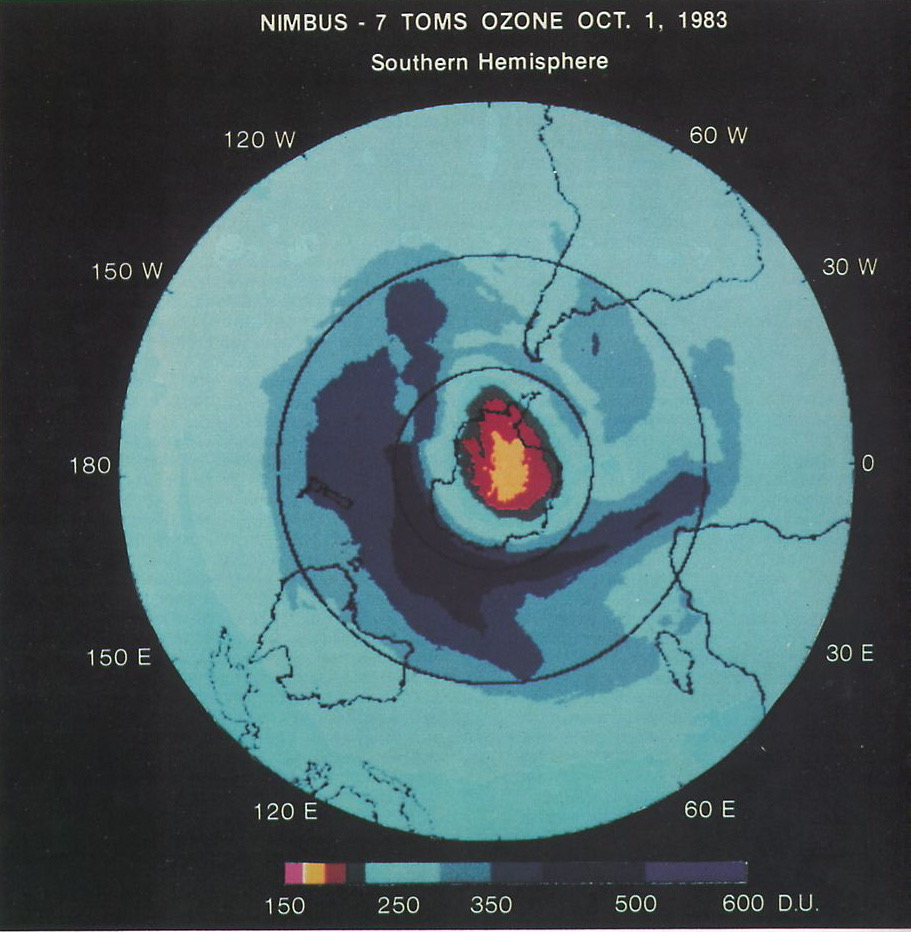
  • Antarctic ozone readings very low
  • Satellite software flagged low values as needing a check
  • Ground team checked and published
  • The odd data was real: the ozone hole
Mission 5: Best fit & anomalies
The EvidenceMission 5 · the case
A circular false-colour map of ozone over the southern hemisphere, with a red and yellow patch of very low values over Antarctica
Satellite ozone readings for 1 October 1983, first shown in August 1985. Red and yellow are the lowest values. Image: NASA Goddard Space Flight Center, public domain, via Wikimedia Commons

Breaking

A hole in the ozone layer

British Antarctic Survey scientists report that ozone above Antarctica collapses every spring. They measured it from the ground, year after year.

Talk about itA reading looks far too strange. What do you do with it?

Mission 5: Best fit & anomalies

05 Key idea

Show the trend

Do

  • One thin, smooth line
  • Straight or curved
  • Points balanced above and below

Don’t

  • Zig-zag point to point
  • Force it through the ends
  • Let an anomalous result drag it
Mission 5: Best fit & anomalies

05 Spot it

Spot the anomaly

Ramp height / cmMean distance / cm
520
1037
1552
2096
2580
  • 20 cm → 96 cm: far above the trend
  • Line predicts about 66 cm
  • Delete it? Not yet, check first
Mission 5: Best fit & anomalies

05 Treat it as a question

Anomalous result? Investigate.

SpotFar from the trend
CheckRecording, maths, plotting
CheckMethod, equipment
RepeatIf you can

Mistake found

Correct it

Use the corrected value

No cause found

Keep, circle, report

Leave it out of the best-fit line

RuleNever silently delete evidence
Mission 5: Best fit & anomalies

05 Conclude

A conclusion needs a number

  • Name both variables
  • Give the direction: increase or decrease
  • Quote two values with units
  • Straight or curved? Strong or weak?

“It went up.”

“Mean distance increased from 20 cm to 80 cm.”

As ramp height increased, mean distance increased.
I know because at 5 cm it was 20 cm and at 25 cm it was 80 cm.
Possible anomalous result: 20 cm, because it is far above the line.
Positive correlation: both increase together.
Mission 5: Best fit & anomalies

05 Peer review

Check it like a marker

  1. Title: what against what
  2. Labels + units on both axes
  3. Even scale that fills the grid
  4. Small, accurate crosses
  5. One best-fit line
  6. Anomalous result circled, or “none”
Give one specific improvement, not “make it neater”
Mission 5: Best fit & anomalies

05 Checkpoint

Quick check

1What is a best-fit line?

One smooth line showing the overall trend of the data

2Why avoid dot-to-dot?

It claims every reading is exact

3What is an anomalous result?

A result that doesn’t fit the pattern

4First step with an anomalous result?

Check the recording and plotting, then repeat it

5Must a best-fit line touch points?

No, balance points above and below

6What makes a conclusion strong?

The relationship between the variables, with values + units
PRESS → TO REVEAL EACH ANSWER

06 Mission 6: Run it yourself

Paper helicopter challenge

independent planningtable designgraph + predictionevaluation

AQA spec: WS 2.2, 2.7, 3.1Physics and Combined Science

THE CASE (2021)

A helicopter on Mars

  • Ingenuity flew on Mars
  • Air \(\approx\) 1% as dense as Earth’s
  • Tested in a low-pressure chamber
  • Measure, change, test again
Mission 6: Solo flight
The EvidenceMission 6 · the case
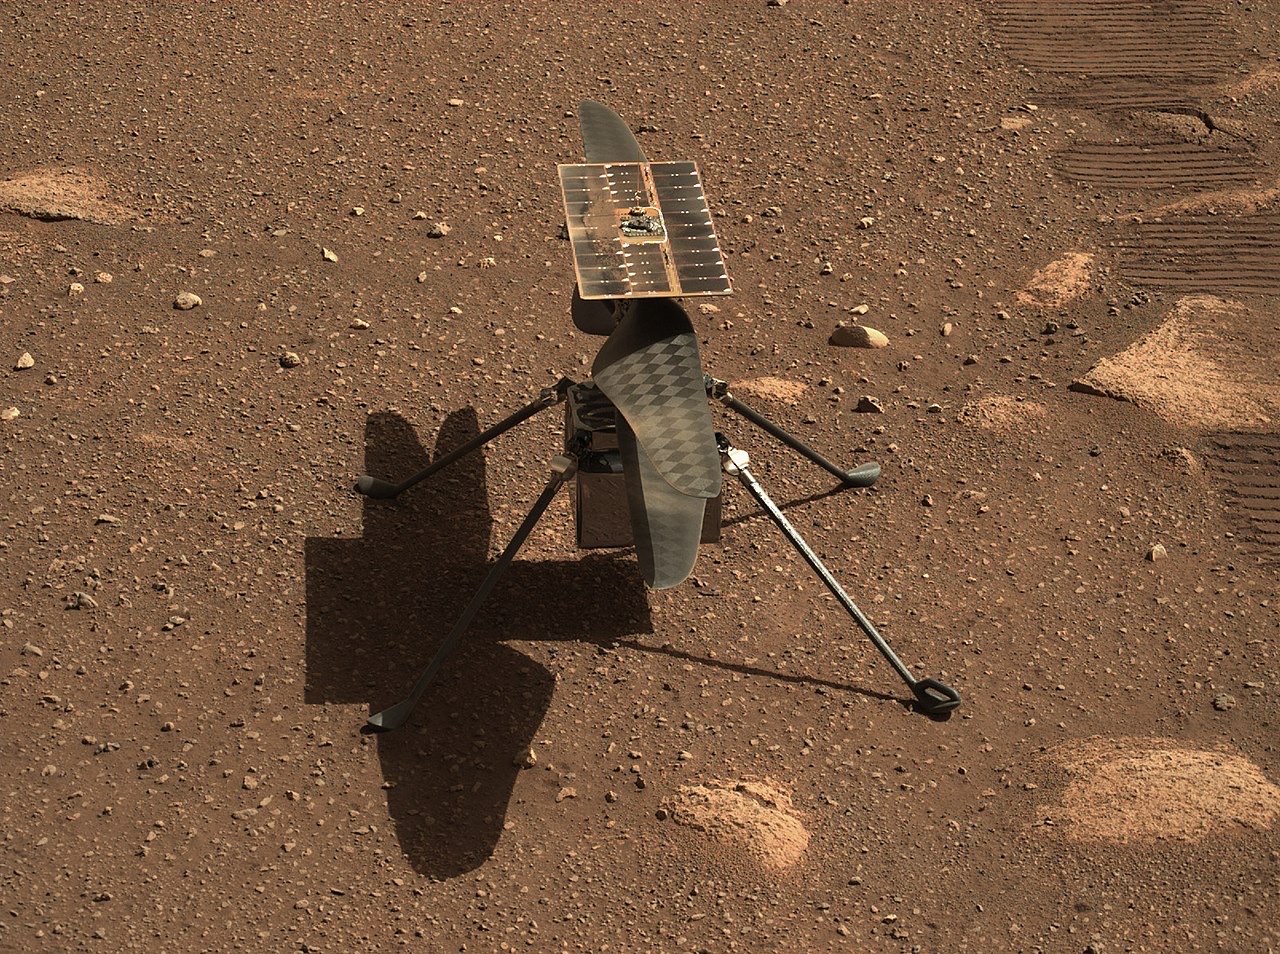
A small helicopter with two long rotor blades and four thin legs standing on reddish, rocky ground
Ingenuity on Mars, photographed by the Perseverance rover on 5 April 2021, two weeks before its first flight. Photo: NASA/JPL-Caltech/ASU/MSSS, public domain, via Wikimedia Commons

Breaking

A helicopter flies on Mars

Ingenuity lifts off in air about 1% as dense as Earth’s. Its rotors are over a metre across and its mass is under 2 kg.

Talk about itWhich one thing would you change first, and what would you measure?

Mission 6: Solo flight

06 Plan before you cut

Wing length → fall time

  • IV: wing length / cm (continuous)
  • DV: fall time / s
  • Control: paper, body, paperclips, drop height, release
  • Range: from 4 cm to 8 cm, 5 lengths
  • Graph: line, because wing length is continuous

Safety

Never climb on furniture; careful with scissors

Mission 6: Solo flight

06 Design it yourself

Design the table

Wing length / cmFall time trial 1 / sFall time trial 2 / sFall time trial 3 / sMean fall time / s
41.081.131.091.10
51.301.351.311.32
61.521.471.511.50
71.701.741.691.71
81.861.911.871.88
IV column first
3 trials + a mean
Units in every heading
Mission 6: Solo flight

06 Graph, conclude, predict

Read between the points

  • Longer wings → longer fall time
  • 4 cm: 1.10 s; 8 cm: 1.88 s
  • Up from the line, across to the axis
  • 6.5 cm → about 1.6 s
Inside the rangeSo the prediction is more trustworthy
Mission 6: Solo flight

06 Evaluate

Problem → effect → fix

Problem

Reaction time

Start and stop of the stopwatch vary

Effect

Scattered times

Random error; short falls hit hardest

Fix

Video timing

Slow-motion video, or electronic timing

“There was human error.”

“Reaction time varied, so fall times were scattered.”

Mission 6: Solo flight

06 Checkpoint

Quick check

1Name three control variables

Drop height, paper type, paperclips

2Heading for the mean column?

Mean fall time / s

3A drop hits a chair. What now?

Note the reason, then repeat that drop

4Where is a prediction most trustworthy?

Inside the range of the data

5Why is reaction time a big problem here?

Fall times are short, so the error is a big fraction

6Improve “human error”

Name it, its effect, a matching fix
PRESS → TO REVEAL EACH ANSWER

07–08 Your investigation

How does \(X\) affect \(Y\)?

testable questionsteam investigationdefensible conclusions

AQA spec: WS 1.6, 2.1, 2.7, 3.8Physics and Combined Science

THE CASE (2015)

Trying to prove themselves wrong

  • LIGO: first gravitational waves
  • Same signal in two detectors ~3000 km apart
  • Months of checks before announcing
  • Find the weakness first
Missions 7–8: Your investigation
The EvidenceMissions 7–8 · the case
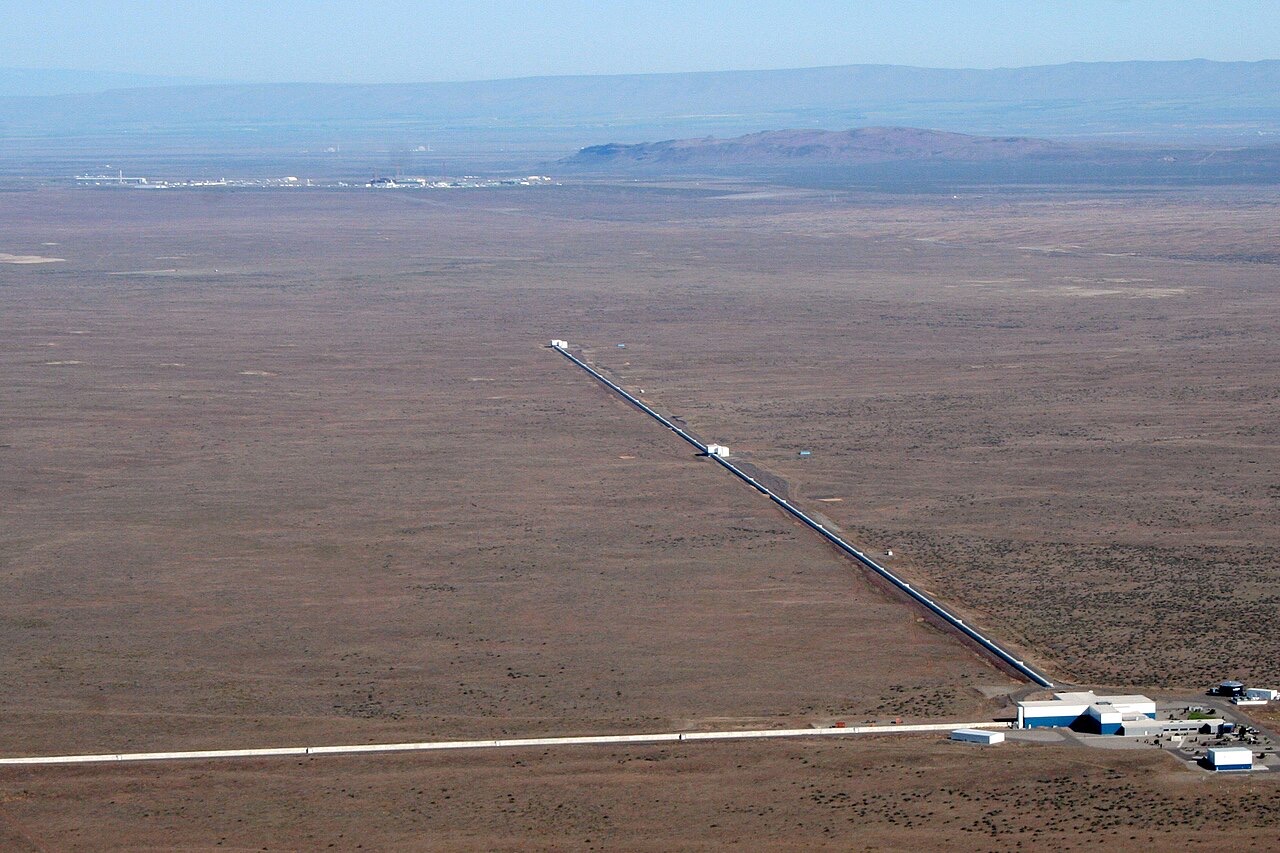
Aerial view of a flat desert with two long straight pipes meeting at a right angle at a group of buildings
The LIGO detector at Hanford, USA, seen from the air. Each arm is 4 km long. Photo: LIGO Laboratory, public domain, via Wikimedia Commons

Breaking

Ripples in space detected

Two detectors about 3000 km apart pick up the same signal: two black holes colliding a billion light years away.

Talk about itHow would you try to prove your own result wrong?

Missions 7–8: Your investigation

07 Choose a question

A question that works

✓ These work
QuestionGraph
How does ramp height affect distance?Line
How does wing length affect fall time?Line
How does surface type affect distance?Bar
How does material affect bounce height?Bar
✗ These don’t
QuestionProblem
What is the best helicopter?Too vague
How does height affect it?DV unclear
Surface → speed, distance, time?Too many DVs
Throwing force → distance?Hard to control
Missions 7–8: Your investigation

07 The rules

One change. One measurement.

  • Pairs or threes
  • One independent variable
  • One dependent variable
  • 3+ control variables
  • 4–5 values or categories
  • 3 trials each → mean
1Question
2Plan + method
✓Teacher sign-off
3Collect
4Graph
5Conclude + evaluate
6Peer review
RuleNo signature, no equipment
Missions 7–8: Your investigation

08 Defend it

Conclude. Evaluate.

Conclusion

Line: As increased, increased / decreased.
Bar: The highest / lowest was .
Evidence: I know because (values + units).

Evaluation

  • One strength
  • One weakness
  • A random error and a systematic error
  • A matching improvement
  • How confident? What extra evidence?
Missions 7–8: Your investigation

08 Peer review

Find the weakness first

  • “How does \(X\) affect \(Y\)?” form
  • All three variable types named
  • Units in the table headings
  • 3 trials, means calculated
  • Right graph for the IV
  • Labels, units, scale, crosses
  • Best fit, anomalous results dealt with
  • Conclusion quotes numbers
ThenWrite the one question you’d ask them
Missions 7–8: Your investigation

Summary

The physicist’s toolkit

Uncertainty

\((\text{max} - \text{min}) \div 2\)

Precision

Precise ≠ accurate

Errors

Repeats reduce random only

Graph choice

Continuous → line; categoric → bar

Data

3 trials → a mean

Axes

IV on \(x\), DV on \(y\), units

Lines

Best fit, never dot-to-dot

Anomalous results

Check, repeat, report

Writing

Numbers and mechanisms

Work like a physicist

Summary

Key words

Independent variableThe one thing you change
Dependent variableThe thing you measure
Control variableKept the same for a fair test
ContinuousAny value on a scale → line graph
CategoricNamed groups → bar chart
MeanTotal \(\div\) number of readings
Best-fit lineOne line showing the trend
Anomalous resultDoesn’t fit the pattern; check it
PredictionA statement suggesting what will happen in the future, based on observation, experience or a hypothesis
Work like a physicist